Group A, Poster #147, Fault and Rupture Mechanics (FARM)
Investigating the regional scale rock strength distribution and its self-similar characteristics from a drone-based high-resolution digital elevation model in Mecca Hills, CA.


Poster Image:

Poster Presentation
2024 SCEC Annual Meeting, Poster #147, SCEC Contribution #13948 VIEW PDF
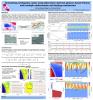
Mecca Hills, California. A DEM with ~6 cm/pixel resolution was generated from over 7000 photographs recovered from an unmanned aerial vehicle (UAV) processed using photogrammetry software. Apparent cohesion values were inferred for each 10 m x 10 m cell based on the Culmann limit-equilibrium slope stability analysis.
The distribution of apparent cohesion values correlates with the local geology, which includes several sedimentary units and strands of fault gouge exposures. The fault gouge shows significantly lower rock strength than the sedimentary units. Within the same sedimentary unit, rocks sandwiched by adjacent strands of the SAF appear weaker, whereas regions identified as structurally less deformed appear stronger. We however do not observe an obvious trend with fault normal distance.
To study the self-similar characteristics of the distribution of apparent cohesion values, we took profiles of apparent cohesion along and across the SAF and calculated the power spectral density (PSD) of the strength profiles. The PSDs appear linear in the log-log space suggesting a fractal nature of the distribution of rock strengths along these profiles. Preliminary results show that the slope of the best-fit lines through the PSDs in the fault parallel direction ranges between -1 to -0.2, whereas in the fault normal direction, the slope ranges from -1.5 to 0.1
SHOW MORE
Citation: Du, N., Sone, H., Ferrier, K., & Williams, R. (2024, 09). Investigating the regional scale rock strength distribution and its self-similar characteristics from a drone-based high-resolution digital elevation model in Mecca Hills, CA.. Poster Presentation at 2024 SCEC Annual Meeting.
Relevant SCEC Themes:
Improving Observations and Closing Data Gaps
Developing Rheologies and Bridging Multi-Scales
MORE FROM FAULT AND RUPTURE MECHANICS (FARM)

|

|

|
|

|

|

|

|

|

|

|

|

|


