Group A, Poster #103, Earthquake Geology
Trona – Ridgecrest Earthquake Sequence - Definitive Mapping and Investigation Through the Use of InSAR
Poster Presentation
2024 SCEC Annual Meeting, Poster #103, SCEC Contribution #13917
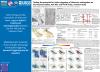
are drawn as enclosed areas of substantial width, not as straight lines. Zone shapes may vary in width or length. The first two WFI and WZI categories are normally located with physical ‘boots on the ground’ and/or drone field work.
Evaluation of InSAR data derived from satellite imagery in areas not easily accessed on foot (Including areas off limits to physical or drone access). The appropriate WI category should be determined and a WI coefficient assigned indicating the statistical quality of the WI rating of fault observation.
Our InSAR defined faulting resulted in 3,765 new faults with a County Hazard Zone status (equivalent to the Alquist – Priolo Fault Hazard designation) with a total of 5,102 faults mapped. We located 797 fault segments using traditional methods. The study area had 113 Quaternary Faults and 68 A-P zones prior to July 4, 2019. Our InSAR defined faulting resulted in 3,765 new faults with a County Hazard Zone status (equivalent to the Alquist – Priolo Fault Hazard designation) with a total of 5,102 faults mapped. We located 797 fault segments using traditional methods. The study area has 113 Quaternary Faults and 68 A-P zones prior to July 4, 2019.Our study area covers over 4,200 square miles.
The background layer is the InSAR data without any hill shade. Red, orange, yellow and light green are the WFI faults equivalent to A-P Zones. The number of faults located for each category within the study area are: Significantly Defined - 1180; Extremely Well Defined - 509; Well Defined – 1114; Defined – 962; Moderately Well Defined – 536; Weaky Defined - 267 - Poorly Defined – 534; Potentially Defined – 1.
Using InSAR to map faut movements is intended as another method to map fault movement. It does not replace existing methods.
SHOW MORE
Citation: Wagner, M. H. (2024, 09). Trona – Ridgecrest Earthquake Sequence - Definitive Mapping and Investigation Through the Use of InSAR . Poster Presentation at 2024 SCEC Annual Meeting.
Keywords: INSAR, Fault Mapping, Wagner Index, Wagner Fault Index, Wagner Zone Index, Zone
Relevant SCEC Themes:
Improving Observations and Closing Data Gaps
MORE POSTERS BY THE AUTHORS

MORE FROM EARTHQUAKE GEOLOGY

|

|

|

|

|

|
|

|

|

|

|

|

|

|
|

|


