Geologic Slip Rate Database Explorer User Guide
Overview
The Geologic Slip Rate Database Explorer provide interactive map-based views of the database source data. The explorers allow users to search and view the Slip Rate Database archive using the pull-down menu near the top left of the interface without having to download the entire Slip Rate Database archive. The pages on this site include the main Geologic Slip Rate Database Explorer page, this user guide, citing usage of this dataset, a disclaimer, and a contact information page.
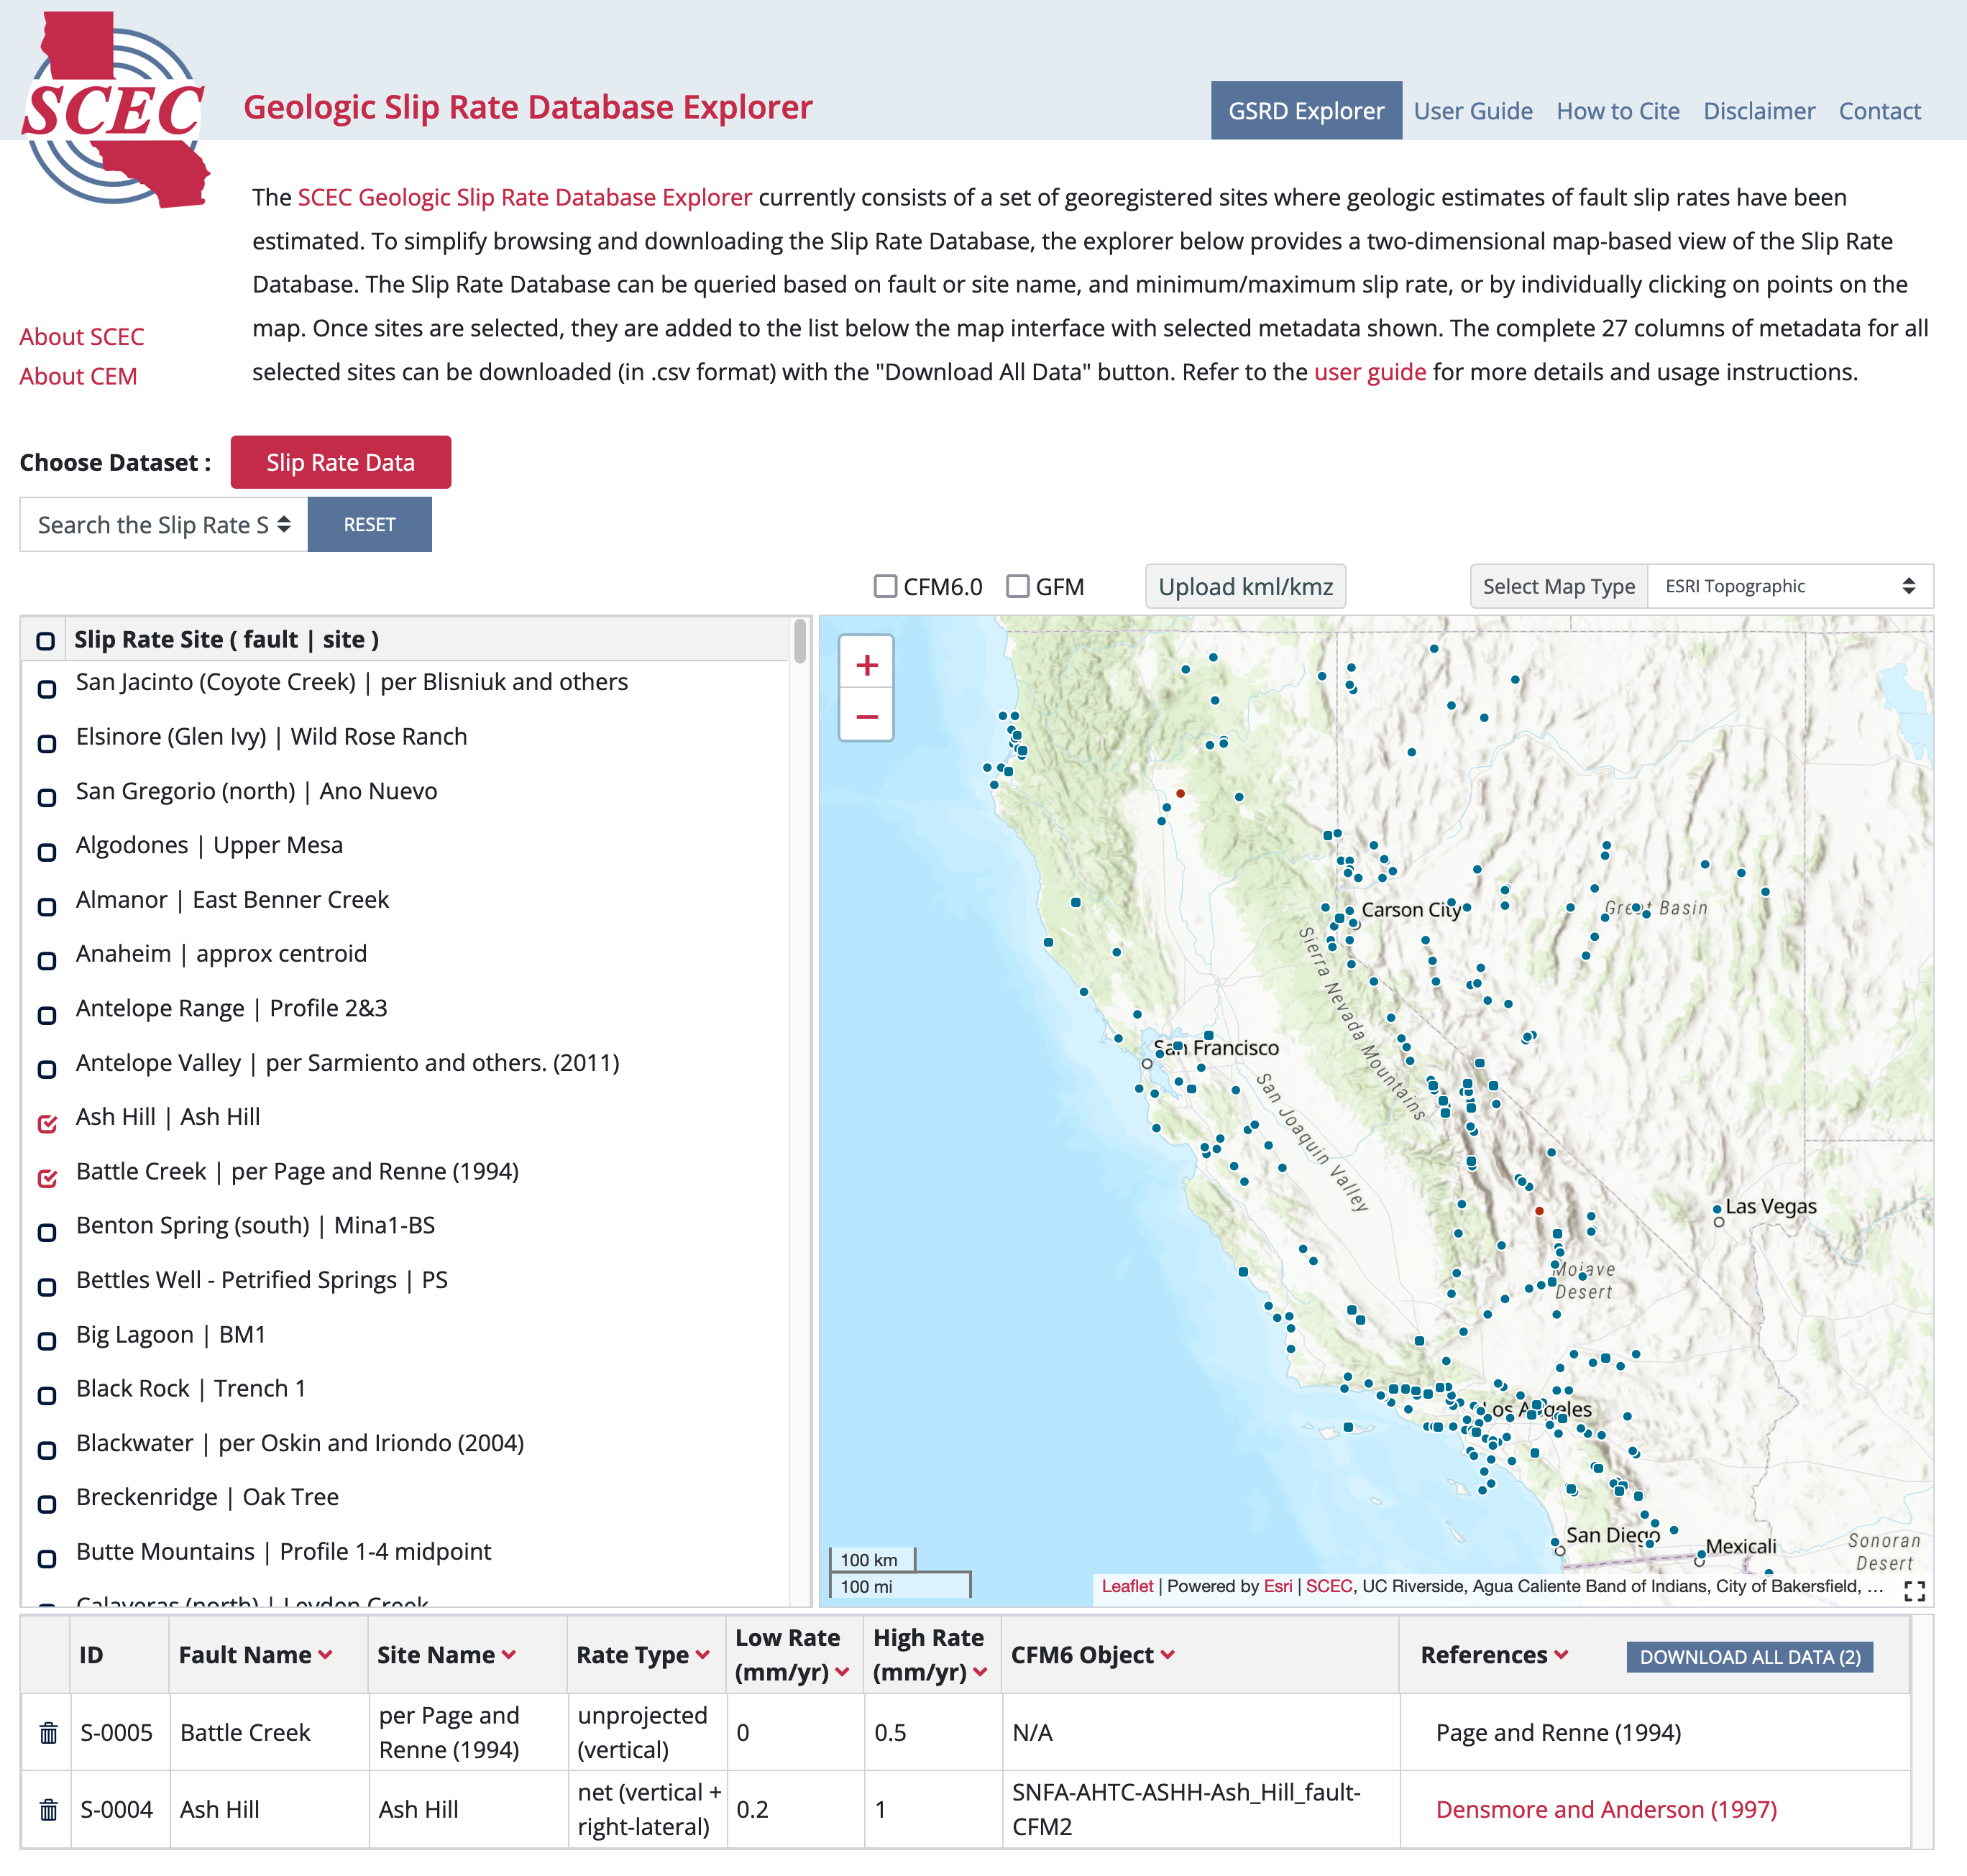
The main Geologic Slip Rate Database Explorer interface is on the explorer page. When first loaded, all sites in the database are listed on the left side of the screen (labeled by fault name | site name) and shown on the interactive map interface (with blue circles) on the right side of the page. Users can click on the checkboxes in the "Slip Rate Site Location" table to select specific sites or click on sites directly on the map (See Viewing and Downloading Metadata below for more details). Sites can be removed from the list at the bottom of the interface by clicking on the trash can icon, or all sites can be cleared by clicking on the “reset” button near the top left of the interface. Note that some of the database locations refer to multiple studies. These are indicated with squares on the map interface. Clicking on a square expands the sites to show the individual database sites.
The interactive map on the right displays the geographic location of each database site. In the top right corner of the interactive map, there is a pull-down menu that allows the basemap to be changed. By default, the basemap shown is ESRI Topographic, but ESRI Imagery, Jawg Light, Jawg Dark, OSM Streets Relief, OTM Topographic, OSM Street, and ESRI Terrain are also available.
The map interface has a small default size, but the map interface can be resized by clicking on the black dashed square icon located in the bottom right corner of the interface. Three size options are available, small (default), medium, and full-screen. The medium and full-screen sizes hide some of the tools, so these options are provided for visualization and data comparison purposes and are not intended to be used when querying the model for download.
To report any bugs or issues, please see the contact page or contact software@scec.org.
Searching/Querying the Geologic Slip Rate Database
The Geologic Slip Rate Database Explorer provides several search criteria, including fault name, latitude/longitude, low rate, and high rate. Most database sites do not have a “preferred” rate, so there is no search by preferred rate option. Once a search type is selected, additional controls will appear in the form of text input boxes, or sliders. Note that due to the large range in slip rate values, the low rate and high rate values are colored on a logarithmic scale.
When performing a latitude/longitude search, there are two search methods. Users can either enter the latitude/longitude values in the text boxes (bottom left first, followed by top right corners of a bounding rectangle), or simply click and drag on the map to draw a bounding rectangle. In either case, any portion of a database site that lies within the bounding rectangle will appear in the search results at the left side of the interface. These search results can be added to the download table at the bottom of the interface by clicking on the checkbox next to the site name, or all sites can be added by clicking on the checkbox at the top of the search results list.
To return to the initial view showing all the faults, click the "RESET" button, or reload the page using your browser’s reload button.
Downloading and Using Data
Geologic Slip Rate Database metadata files in CSV format are available for download from this site. First, select the desired database sites by clicking on individual circles on the map, or using the search methods discussed earlier in this guide. Selected sites are highlighted in red on the map when clicked and key metadata for the selected site(s) appears in the table at the bottom of the interface. When available, references for the Geologic Slip Rate Database are provided as clickable hyperlinks that link directly to the source publications/resources. Click on the “DOWNLOAD ALL DATA” button to download a CSV file with the complete metadata (the full 27 columns) for every selected site. CSV files are plain text (ASCII) and can also be directly opened by Microsoft Excel, or Google Sheets. For more information about the complete metadata contents, refer to the Geologic Slip Rate Database Zenodo archive.
KML/KMZ Uploader
Users can now upload their own spatially registered data in kml/kmz format for display on the map interface. This is intended to allow users to compare their own data to the Slip Rate Database. The kml/kmz uploader currently supports point/line data (kml/kmz), image overlays (kmz only), and remote links in kml/kmz file are not supported. If you discover a kml/kmz file that will not display correctly, please contact us at software@scec.org.
Browser Requirements
This site supports the latest versions of Chrome, Microsoft Edge, Firefox, and Safari.
More information including a complete model archive can be found at: https://www.scec.org/research/gsrd.