CSM Explorer User Guide
Community Stress Model (CSM) Explorer Overview
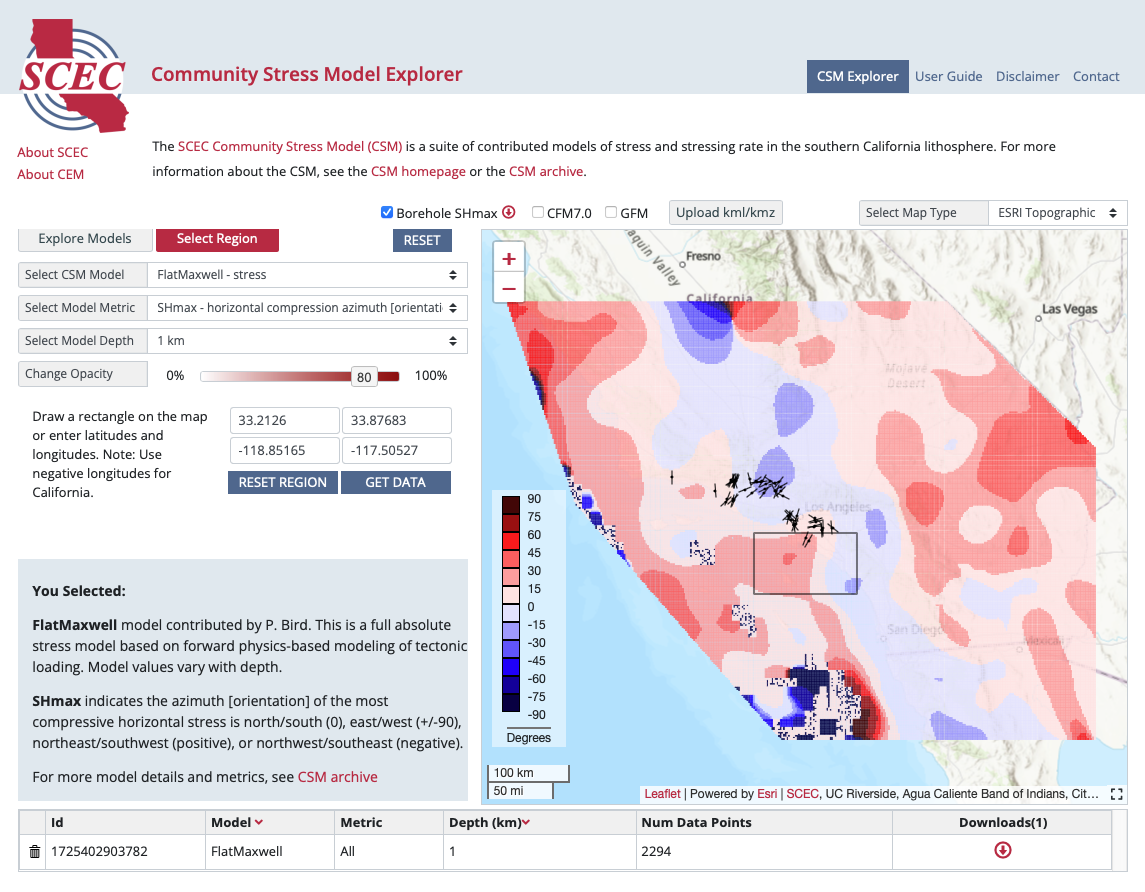
The CSM explorer provides interactive map-based views of the CSM v2024 contributed models. The explorer allows users to select the model of interest, a scalar stress metric to display, and a depth of interest (using drop down menus at the left of the interface). Users can add additional data overlays of Borehole SHmax azimuths (from Luttrell & Hardebeck, 2021), Community Fault Model fault traces, Geologic Framework Model regions (a component of the SCEC Community Rheology Model), or upload their own data in kml or kmz format. Users can also download selected model data without having to download the entire CSM model archive. The pages on this site include the CSM explorer page, this user guide, citing usage of this dataset, disclaimer, and a contact information page.
The interactive map on the right displays the geographic extent of the selected model, using the selected metric at the selected depth. The color scale at the bottom left indicates the range of values associated with each color in the current view. In the top right corner of the interactive map, there is a pull-down menu that allows the base map to be changed. By default, the map shown is ESRI Topographic. The other map types are: ESRI Imagery, Jawg Light, Jawg Dark, OSM Streets Relief, OTM Topographic, OSM Street, and ESRI Terrain.
The map interface has a small default size, but the map interface can be resized by clicking on the black dashed square icon located in the bottom right corner of the interface. Three size options are available, small (default), medium, and full-screen. The medium and full-screen sizes hide some of the tools, so these options are provided for visualization and data comparison purposes and are not intended to be used when querying the model for download.
To report any bugs or issues, please see the contact page.
Explore CSM models
The CSM explorer has two modes: “Explore Models”, and “Select Region”, accessed by the rectangular buttons at the top left. “Explore Models” is the default mode and allows users to select a model contribution, a stress metric, and a depth using dropdown menus. The interactive map at right updates with each selection. Users can adjust the transparency or opacity of the model using the “Change Opacity” slider, or return to the default view at any time using the “Reset” button.
The “Select CSM Model” dropdown menu lists the short name of each contributed model, and whether it is a model of stress or stressing rate. For details about contributed models, see the CSM homepage or the CSM archive.
The “Select Model Metric” dropdown menu lists available scalar metrics, a brief description, and whether the metric gives an indication of stress orientation or magnitude. See below for a summary of available metrics. Note that not all metrics are applicable to every model (unavailable metrics/depths are shown in light gray). If you select a metric that is not available for the selected model, the explorer will display the notification “switching to a different metric/depth for this model” and revert to the default metric for that model.
Users can select the depth of interest using the “Select Model Depth” dropdown menu. Note that not all depths are applicable to every model (unavailable metrics/depths are shown in light gray). If you select a depth that is not available for the selected model, the explorer will display the notification “switching to a different metric/depth for this model” and revert to the default depth for that model. Note that some models do not vary with depth, even though they may be applicable to multiple depths. If you select a different depth for a model that does not vary with depth, the interactive explorer will update but the image will not change.
A brief explanation of the selected model and metric appears at the bottom left, updated each time a new model or metric is selected. A few models also include an "information button" () with further details about the visualization. For further details about each model, see the CSM homepage or the CSM archive. For additional stress metrics indicating orientation and magnitude, see the CSM archive.
Stress Metrics Available for Viewing
Users can view CSM model contributions using the following scalar metrics:
SHmax indicates the azimuth [orientation] of the most compressive horizontal stress is north/south (0), east/west (+/-90), northeast/southwest (positive), or northwest/southeast (negative).
Aphi combines the shape parameter ratio of principal stresses with the expected faulting regime based on which principal stress is most vertical. Fault regime is normal faulting (0-1), strike-slip faulting (1-2), or reverse faulting (2-3).
Isotropic stress indicates the mean of the principal stresses (S1+S2+S3)/3 is tensional (positive) or compressional (negative). For easier visualization, the display range excludes the highest and lowest 0.1% of values.
Differential stress is the difference between the most tensional and most compressional principal stresses S1-S3. It is always positive. For easier visualization, the display range excludes the highest and lowest 0.1% of values.
Other scalar metrics of both orientation and magnitude are available from the CSM archive. See CSM archive metadata for details.
Select Region to Download Data Subset
The “Select Region” mode, accessed by the rectangular button at the top left, allows users to download data from a single contributed model over a single selected subregion. Users can draw a box around their region of interest, or enter longitude and latitude bounds in the boxes at left and click the “get data” button. The selected region will be displayed as a gray box on the interactive map.
Once a user selects a region, the table at the bottom of the interface will populate with the name and depth of the current model view, along with an indication of how many data points of the current model and depth are contained in the region.
When the user is satisfied with their model, depth, and region selections, use the red download button () to download a file in .csv format containing only the points from the selected model, depth, and subregion. The downloaded file contains the full record for each point, including the cartesian stress tensor components and all available scalar metrics.
To download data from the same selected subregion for a different model or depth, simply select a different model or depth using the dropdown menus at the top left of the interface. The table at the bottom will update with an additional entry allowing you to download the new data subset.
Users can remove entries from the download table at any time by clicking on the trashcan button at the left, or can clear all entries by clicking the “Reset Region” button by the longitude and latitude range boxes.
The complete set of CSM model contributions, including cartesian stress tensor components, additional scalar metrics, and associated metadata are available from the CSM archive.
Additional Data Overlays
At the top of the interface, there are checkboxes that turn on or off additional data overlays that the user may find helpful.
Borehole SHmax adds SHmax data from Table 1 of Luttrell and Hardebeck (2021). SHmax azimuth is indicated both by a black bar centered at the borehole location and by a circle at the borehole location colored by SHmax value. This data can be downloaded in .csv format here or by clicking the red down arrow button ().
CFM7.0 adds the surface traces of version 7.0 of the Community Fault Model faults, with blind faults indicated by a dashed line. Click on each individual fault to see a popup of its name.
GFM adds the Geologic Framework Model regions defined as a component of the Community Rheology Model. Click each polygon to see a popup of the region’s name.
KML/KMZ Uploader
Users can upload their own Google Earth kml/kmz files for display on the map interface. This is intended to allow users to compare their own data to the CSM. The kml/kmz uploader currently supports point/line data (kml/kmz) and image overlays (kmz only). kml/kmz files with remote links are currently not supported. If you discover a kml/kmz file that will not display correctly, please contact us using the information on the contact page.
Browser Requirements
This site supports the latest versions of Chrome, Microsoft Edge, Firefox, and Safari.
More information, including a complete model archive, can be found at: https://www.scec.org/science/csm.